Fabric Default Semantic Models: One for all, all for one!
8 February 2024

One of the exciting new features of Microsoft Fabric is the Introduction of Default Semantic Models for Lakehouses and Warehouses. A Power BI semantic model is a way of describing and organizing data for analysis and reporting. It uses terms that make sense to business users and allows for in-depth exploration. In the first part of the blog, we explain what it is and how it works. If you just want to know why we are excited for this new Fabric feature, you can scroll all the way down.
What is a semantic model?
| A semantic model is the former Power BI dataset, which is renamed to Power BI semantic model. This is the base data model for reports and dashboards in Power BI. It represents data ready for reporting, visualization, discovery and consumption. The model itself is usually structured like a star schema with facts (measurable and quantitative data) and dimensions (descriptive attributes or categories) that helps to analyze the data. |
While it used to be only available in Power BI, you can now build this model directly in Microsoft Fabric using your tables from the Lakehouse or Warehouse. There is no functional difference between the former Power BI datasets and Fabric semantic models.
When you create a Lakehouse or a Warehouse in Microsoft Fabric and load data in it, a default semantic model is automatically created. The default semantic model is represented with the (default) suffix. The default semantic model is queried via the SQL analytics endpoint and updated via changes to the Lakehouse or Warehouse.

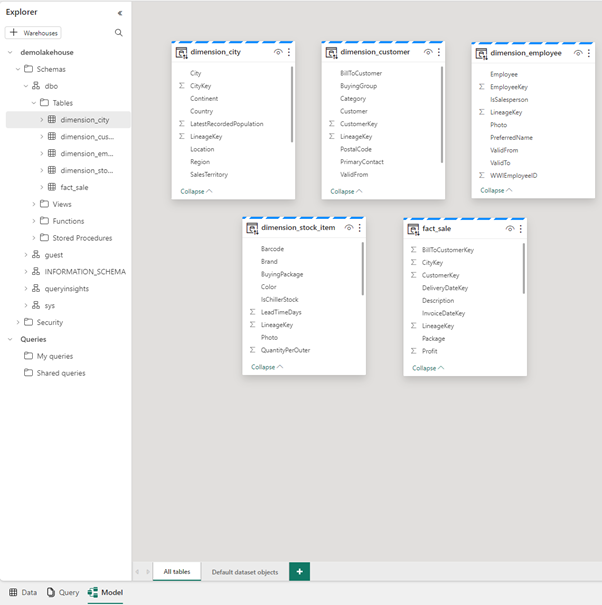
From your workspace, open the SQL analytics endpoint and click the model tab below. Now you can start modelling your data.
Key Features
Relationships in semantic models
In the model view, we can define relationships between tables. Relationships relate one column in a table to one column in a different table. It is not possible to relate a column in a table to a different column in the same table.
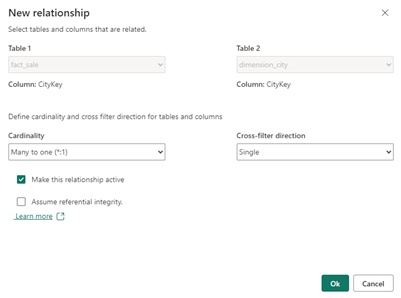
Each model relationship is defined by a cardinality type. There are four cardinality type options, representing the data characteristics of the "from" and "to" related columns. The "one" side means the column contains unique values; the "many" side means the column can contain duplicate values.
- One-to-many (1:*)
- Many-to-one (*:1)
- One-to-one (1:1)
- Many-to-many (*:*)
If a data refresh operation attempts to load duplicate values into a "one" side column, the entire data refresh will fail.
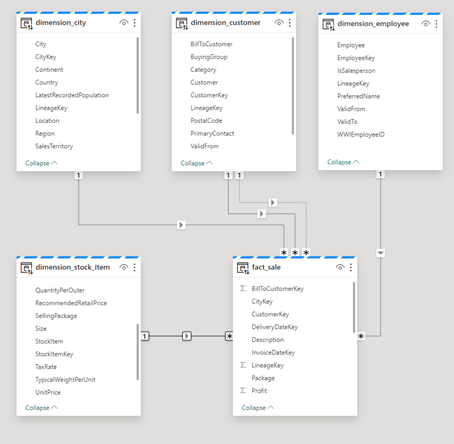
Multiple relationships can exist between the same tables, but there can only be one active relationship. The active relationship is represented with a solid line and the rest is represented with a dotted line. See screenshot below you can see that the star schema contains 2 customer relationships, an active one that depicts the customer and an inactive one for the customer that will be billed. By default, the active relationship is used in filters. But in DAX measures you can explicitly use an inactive relationship to filter upon using the USERELATIONSHIP DAX function.
Measures in semantic models
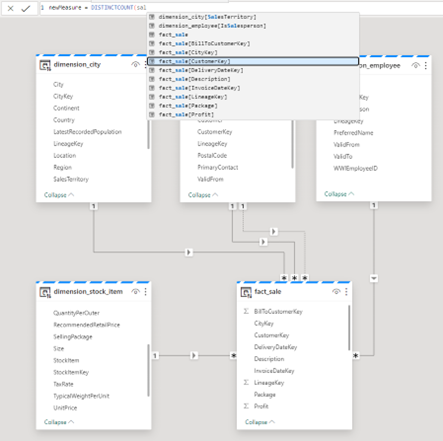
Measures can be created in a semantic model as well. Just like in Power BI, you can use autocomplete for DAX formulas. DAX provides a lot of built-in functions you can use to create your measures based on a complete column or a table. The following categories of functions are available to use: Date and Time, Time Intelligence, Information, Logical, Mathematical, Statistical, Text, Parent/Child, and Other functions.
Remarks on semantic models
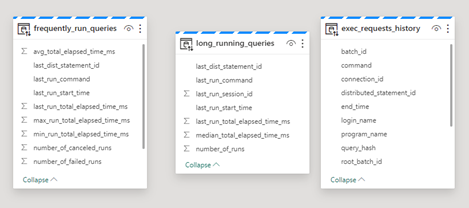
All elements in the semantic model can be hidden in the report view and 3 views are automatically added to the semantic model that can be queried to get query insights.
Why is this feature so exciting?
The default semantic model looks a lot like a dataset in Power BI. Why is it so exciting then? Well, now you as a back-end developer can offer a complete data model to your data users with relationships and measures. Before you could only offer tables and some documentation, and a Power BI developer had to create a model based on the tables and the documentation.
Semantic models open the door to the DirectLake connection method. DirectLake is best of both Import and Direct Query connection methods. This allows Power BI to read data directly from OneLake so it is always up to date. And it has the performance of the import connection method without having to copy the data to the Power BI service.
Conclusion
The default semantic model allows you to offer a complete data model to your data users instead of just some tables and a description on how to link them. The look and feel of creating relationships and measures is exactly like in Power BI. Together with the performance and ease of use of the DirectLake connection method will make this a great feature of working with Microsoft Fabric. Want to get started with Microsoft Fabric or need any help in your data journey? Do not hesitate to contact us!

